The architecture is very simple. There is a server running GRR where all the clients are connected. This same server is accessible via HTTP/s and also via console to gather information from the compromised system.
The clients, needs to install / execute a package, in order to connect to the server and receive instructions from the server, like for example dump the memory, list the processes running or perform a MACTimes.
In the documentation there is very good instructions on how to perform the installation on the server side, so there is no point on repeating the same again :)
Once the server is done, and it is reachable through HTTP, it is necessary to install the client. In this case, the agent to install is the amd64 bits. The easiest way to do it is directly accessing the URL and browsing to the binary. However, there is other mechanism to do it remotely like using 'psexec'.

Once the binary is installed, I can see there is a new service name "GRR Monitor"
Next step is to search for the system to analyse, the one which has been compromised.
This is done through the search box on the top-right of the web interface, and the system can be searched by hostname, IP, MAC address....

All the information from that specific host is displayed in the "Host information" link, on the left side of the management web interface

If I wanted to perform the memory analysis, the first thing to do would be to dump the memory of the system. This would be the first approach to avoid losing much evidence from memory.
To do this, a 'new flows' must be created through the "Start news flows" menu. In essence a flow is just an action, like for example list a registry, list the processes, dump the memory..

But in this case, the first thing I'm going to do is to analyse the filesystem. To do this I go to the 'Browse Virtual Filesystem", and press the refresh button under the drive C:

This creates a "launched flow":
Once the flow is finished (it can take some time), the file system can be browsed. This same approach can be done for the registry of the system

Once the flow is finished (it can take some time), the file system can be browsed. This same approach can be done for the registry of the system.
All the 'flows' executed are displayed in the "manage launched flows", and the results are displayed in the "browse virtual filesystem".
For example, in the screenshot below I can see there are two flows executed, one to list the processed and the second one to list the connections
Now if I go to to "browse virtual filesystem" -> "analysis"-> "list processes" I can see all the processes running on the system:

For example, some interesting process I see is "WINWORD.EXE", which opens a doc file name "file.doc"

Looking at the connections ESTABLISHED, I see a HTTPS connection to an IP from Chile. This IP is already reported in VirusTotal as malicious: https://www.virustotal.com/es/ip-address/186.67.56.157/information/

Next step is to generated the MACTimeline so I can analyse the filesystem. This is done through the "flow" presented in the screenshot below:

Again, a new 'flow' is created and once it is executed, the results can be seen or downloaded

Now I'll focus the analysis in the MAC timeline, and I will start looking at the 'file.doc' which it is suspicious to me.
Around 9:51:07 the suspicious file was opened
Following to that, a temporal file has been created. This is due to the way MS works creating temporal backups to avoid losing the data.
A few minutes later, there is a very interesting file created in the timeline. This file looks like VBS file
So let's take a look to it. In order to do that, with GRR we can request files from the system, even if they have been deleted. To do this, we need to browse to directory in the filesystem where the file is, and press 'get a new version'. After some second, the file will be gateherd from the system and presented in the web GUI.
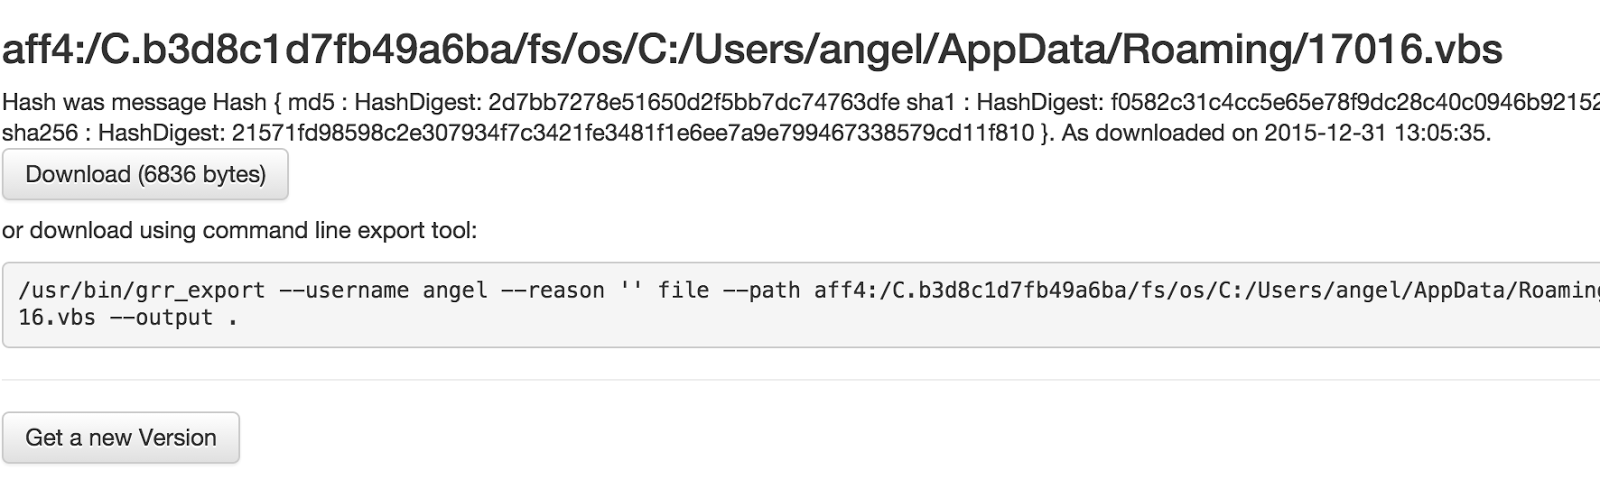
So now the file can be downloaded and examined. Looking at the file I can see there is an obfuscated VBS

Once we have this file, I can investigate it with a debugger i explained in a previous post.